Research Article | | Peer-Reviewed

Assessment of the Vulnerability of Aquifers in Basement Areas to Pollution from Agriculture: The Case of the Boulbi Rice Plain in Burkina Faso

Received: 21 May 2024    Accepted: 6 June 2024    Published: 27 June 2024
Views:       Downloads:
Abstract

Groundwater is a major source of water, meeting the domestic water needs of more than 70% of Africa's population. Although prized for its relatively good quality compared with surface water, groundwater is increasingly subjected to multiple sources of pollution. Long thought to be the solution to increasing agricultural production and achieving food self-sufficiency, agricultural inputs are now being pointed out in Burkina Faso as a major source of water pollution. However, few studies exist showing the contribution of agricultural inputs to groundwater pollution. The aim of this study is to show the impact of the use of agricultural inputs on groundwater quality: the case of the Boulbi valley rice-growing area in Burkina Faso, West Africa. Soil properties were measured using a double-ring infiltrometer and Harmonized World Soil Database. Groundwater recharge was assessed by Thornthwaite’s equation. The DRASTIC, GOD and SI methods were applied to map the valley’s vulnerability. Fertilizers and phytochemicals were recorded by surveys. A sampling of surface and groundwater was done in 32 locations and the chemical characteristics (pH, EC, NO3-, SO42-, PO42- and K+) confronted with the vulnerability indices. Results show that the soils were predominantly clay (41%), silt (37%) and silty sand (22%). Twenty types of phytochemicals were used, among which 35% were composed of the controversial glyphosate (denounced as carcinogenic) and 30% made with paraquat chloride also accused of being responsible for several self-poisoning. All the three methods pointed to a low vulnerability risk, partly because of the purification role of clay. The average pH is 8.2 ± 0.4, explaining the low-rice yield (<4.0 tons/ha), in spite of fertilizer use. Although the risk assessment rendered non-alarming situation, preventive measures about health and environment need to be taken.

Published in American Journal of Environmental Protection (Volume 13, Issue 3)
DOI 10.11648/j.ajep.20241303.11
Page(s) 49-68
Creative Commons

This is an Open Access article, distributed under the terms of the Creative Commons Attribution 4.0 International License (http://creativecommons.org/licenses/by/4.0/), which permits unrestricted use, distribution and reproduction in any medium or format, provided the original work is properly cited.

Copyright

Copyright © The Author(s), 2024. Published by Science Publishing Group

Keywords

Burkina Faso, Chemicals, DRASTIC, GIS, GOD, Groundwater, Pollution, SI, Vulnerability

1. Introduction
Water is a vital, complex and fragile resource; serving to meet multiple needs of the living world. Among these vital needs, one can mention agriculture, food, domestic and industrial requirements. The prodigious growth of chemical production industries in the 20th century had a considerable impact on all production sectors of the modern economy. Unsustainable management associated with demographic growth that does not match the means of production has been pointed out as being the cause of qualitative and quantitative stress on water resources . In addition, the use of ever more efficient chemical fertilizers has led to spectacular yield increases . In particular, the need to feed an ever-increasing population has imposed massive agricultural production, itself relying on the chemical industry to fight against plant diseases, animal pests of crops as well as weeds . One of the consequences is the contamination of ground and surface water by chemicals in both urban and rural areas . Against this backdrop, and with a view to protecting water resources from potential contamination, researchers and resource managers have devised methods for assessing the vulnerability of aquifers to contamination, based on activities at or near the ground surface . These methods and techniques fall into three main categories: i) statistical methods, ii) simulation methods, and iii) cartographic indexing methods.
The last two methods - known as indexing methods - are the most widely used and are considered by many to be the closest to the reality of field situations . Thus, vulnerability maps transcribe the threat of potential groundwater contamination and can be used for land-use planning and important related regulations . In karstic zones, characterized by preferential infiltration paths, these maps are proving to be excellent means of protecting springs and wells . One of the standard methods of assessing groundwater vulnerability used in the present study is DRASTIC (cartographic indexing method), developed by Aller et al in 1987 in the USA . DRASTIC is an acronym, the letters of which have the following meanings: i) D is the depth to the water table, ii) R is the recharge of this water table, iii) A is the first letter of the word aquifer, iv) S is also the first letter of the word soil, v) T is the initial of the word topography, vi) I represents the Vadose zone (the saturated medium immediately above the aquifer), and vii) C represents the hydraulic conductivity of the aquifer. Thus, this method uses seven parameters of the geological and hydrogeological environment of the groundwater under investigation .
The second cartographic indexing method used in this study is GOD , which is similar to the previous one, but uses only three parameters. These three parameters are the type of groundwater (letter G), the lithological characteristics (letter O) of the layer overlying the aquifer, assessed by the type of lithology (silt, gravel, sandstone, limestone, etc.) and porosity, and the depth of the water table surface (letter D). This method was also created in 1987, but in England. It was originally formulated for use in data-sparse areas. Like DRASTIC, it uses an empirical approach based on the principle that the vulnerability of an aquifer is a function of the inaccessibility (in terms of pollutant penetration from the ground surface) of the saturated zone, and the purification potential of the layer above the aquifer . The third method used in this study is the Susceptibility Index (SI) . The main concern, that led to the development of the SI method in 2000 in Portugal by Ribeiro et al, was to assess the risk of groundwater contamination by nitrates . The SI method is mainly based on vulnerability associated with vertical infiltration into the soil, and uses five parameters. It considers pollutants of agricultural origin, in particular nitrates and pesticides .
In countries in the Sudano-Sahelian zone of West Africa such as Burkina Faso, data and analyses establishing the link between the use of chemical inputs and the consecutive pollution of surface water and, especially, groundwater in irrigated lowlands located in peri-urban areas such as Boulbi are virtually non-existent. Consequently, the general objective of the present study is to produce a comparative assessment of the vulnerability of the water resource – under the impact of the use of agricultural inputs – in the Boulbi irrigated plain, located in a peri-urban area some 25 km from Ouagadougou, the capital of Burkina Faso in West Africa (Figure 1).
2. Material & Methods
2.1. Presentation of the Study Area
The irrigated rice-growing valley bottom of Boulbi (Figure 1)—located in the central region of Burkina Faso (latitude 12°14' 01.63’’N and longitude -1 31' 52.33“W) at about 25 km from Ouagadougou on the National Road No. 6—covers a total area of 85 ha. An area of 75 ha in the valley is sown land and divided into seven blocks. It was developed in the years 1960s mainly for rice production by the Republic of Taiwan. Cooperation between the Republic of Taiwan and Burkina Faso dates back to 1965; This cooperation was mainly carried out in the agricultural field with the presence of a Chinese agricultural mission. This mission undertook the development work of the plain of Boulbi, to demonstrate irrigated rice cultivation . In May 2018, the diplomatic relationship between Burkina Faso and Taiwan was severed, to the detriment of its relations with the People’s Republic of China . Hence, agricultural cooperation is currently discontinued. The study area is covered by a tropical climate of the Sudano-Sahelian type (600 mm to 900 mm of rainfall per year). The hydrographic network of the study area is part of the Nariarlé sub-basin, which has an area of about 1000 km2 and is an important watercourse that joins the Massili River to flow into the Nakambe River on the left bank . The topography is marked by altitudes between 280 m and 300 m, with three main morphological units: a functional glacis, a battleship-level offering opportunity for road construction, and the lowlands and water bodies that offer opportunities for agricultural development. The geology of the study area is represented by a crystalline complex of Precambrian D age Antebirrimian . The hydrogeological model in the Burkinabe basement zone is composed of three superimposed aquifer systems, which are, from bottom to top: sound rock, fractured/cracked aquifers, and altered aquifers (alterites). Alterites in the region vary in thickness from 10 to 35 m, while fractured/fractured aquifers are only around ten meters thick . The wells dug by the valley's farmers draw water from the altered aquifers.
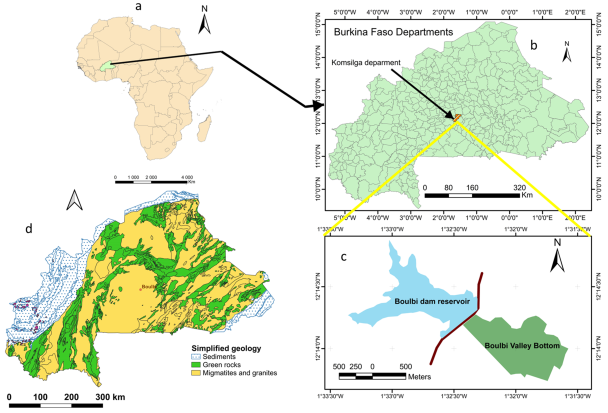
Figure 1. Location of Burkina Faso a), Location of the department of Komsilga b), Location of the Boulbi Valley Bottom 1c), Simplified geology of Burkina Faso d).
2.2. Methods for Mapping Pollution Vulnerability
The groundwater resource media can be defined as a complex system with several components interconnected by water flow (Figure 2). There are three media separated by two important boundaries: the land surface and the water table. The media located between the land surface and the water table is called the vadose zone. It includes the soil media containing organic matter and where an intense microbial often take place. This is the area explored by crop roots. However, the wider vadose zone corresponds to an unsaturated zone above the water table. In this zone, water is mainly located in the pores of the soil which is essentially made of weathering of basement rock. From Figure 2, it can be seen that the groundwater resource is located below the water table. The media that contains this groundwater is called aquifer. This media is either made of advanced weathered rocks or alterations, or of basement rock . In case of the alterations, water is located in the pores of the soil, while it would be found rather in the fractures in case of the presence of a basement rock . Wells often capture the shallow groundwater present in the alterations essentially made of clay as thick as 40 m in Burkina Faso . When groundwater is located in deep basement rocks fractures, boreholes are used to pump and supply irrigation or drinking water. The porosity and the permeability of alterations and the rocks determine the flow of groundwater through the two media. This flow is the vector that conveys pollution. Hence, the topographical, hydrological, and hydrogeological characteristics of the two media and the two boundaries, in addition to the nature of the pollutant, play a key role in assessing ground water vulnerability to pollution.
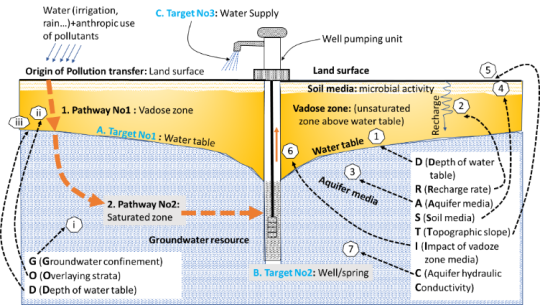
Figure 2. Groundwater vulnerability factors and process according to DRASTIC and GOD methods .
Several groundwater vulnerability assessment methods exist. Some have been used by environmental scientists for more than 30 years . In the present study, three methods are applied: DRASTIC ; GOD and SI , and the results will be confirmed or refuted by chemical analysis in the laboratory.
The DRASTIC Model
The DRASTIC approach was created by Aller and al. in 1987 in the USA . It aims to “assess groundwater pollution potential in hydrogeological setting”. The authors called it a Numerical Ranking System (NRS), although expressions such as “methodology”, “method”, “approach” or “model” are also used . The NRS is built upon 4 quantitative and 3 qualitative factors having a potential impact on groundwater vulnerability to pollution. The 4 quantitative factors are (Figure 2):
1) D (m) or the depth of the water table. This depth is the layer that the pollutant cross to reach the water table. Therefore, it is reasonable to consider that the vulnerability is inversely proportional to D;
2) R (mm/year) or net recharge. It represents the cumulative infiltrated water that reaches the aquifer. It is assumed that vulnerability to pollution increases when R increases. Furthermore, 3 types of recharge can be defined: direct, indirect and localized;
3) T (%) or topography is the average terrain slope, thus including also the variations around this average. One can reasonably assume that the higher the slope, the higher the runoff and the lower the infiltration and the lower the pollution of groundwater;
4) C (mm/day) is the aquifer hydraulic conductivity, i.e., quantification of the aquifer capability to let water flow across it. It is logical to admit that the higher the C value, the less vulnerable is the aquifer because water content in regularly renewed (i.e., not confined).
The three remaining factors in the DRASTIC system are qualitative data. These are the following:
1) A or the aquifer media, consisting of various types of rocks containing the aquifer water;
2) S or the soil media, formed by the upper part of the vadose zone, holding organic matter and often the site of intense microbial activity ;
3) I or the vadose zone impact. It is made of the unsaturated layer located between the water table and the soil media.
Each of these 7 factors was assigned—to use the terminology dear to the GIS (Geographic Information System) world—3 attributes, which are a weight, a range and a rating. The weight (w), a quantitative data, was set up by the experts of EPA (Environmental Protection Agency of the USA) on the basis of their knowledge consolidated by various studies . These weights cannot be changed by the researcher. The factors assigned weight run from 1 (least significant) to 5 (most significant). As for the second attribute, the range (there is no symbol), it is made of qualitative or quantitative data. When related to quantity, the range is materialized by intervals. This applies to quantitative factors such as D, R, T, C as previously described. For example, the range of the water table depth D is made of the interval [0.0-1.5 m; 1.5-4.6 m, …]. On the other hand, when the range is related to quality, it is materialized by natural entities. This applies to A, I, S as previously described. For example, a range of the soil media S can be [clay loam, silty loam, loam…]. The extended description of the range for each factor is provided by the authors of DRASTIC, and the researcher can only choose the values that fit the best of his own data. Finally, the third attribute, the rate (r), is a quantitative data applied to all the 7 factors. The rating values are also set up by the authors as a standard extending from 1 to 10 for each factor. The researcher, after reading one factor and its first two attributes that are the weight and the range, can only deduce the corresponding rate.
After the determination of each of the 7 factors, their weight, range and rate, the DRASTIC index IDRASTIC is calculated such as (1):
IDRASTIC=Dw.Dr+Rw.Rr+Aw.Ar+Sw.Sr+Tw.Tr+Iw.Ir+Cw.Cr (1)
Where the characteristics are (See Supplementary materials S1):
w: under script meaning that a parameter weight is considered;
r: under script meaning that a parameter rate is considered;
D (m): the depth of the water table; quantitative data;
R (mm/year): net recharge; quantitative data;
A: aquifer media; qualitative data;
S: the soil media; qualitative data;
T (%): average terrain slope representing the topography; quantitative data;
I: vadose zone (unsaturated layer between the water table and the soil media) impact; qualitative data;
C (mm/day): the aquifer hydraulic conductivity, quantitative data.
Several modifications were introduced into the DRASTIC method when dealing with areas with specific conditions . One of these derived models was dedicated to areas of intense agricultural production. Under such agricultural conditions, higher or smaller weights were assigned to soil media (S), and the topography slope (T), the impact of the vadose zone (I) and the aquifer hydraulic conductivity (C). The resulting modified model is called DRASTIC-P, where P stands for pesticides . However, the current study used only the general DRASTIC model, whose 7 parameters are described in supplementary materials S1, because several studies pointed out its good accuracy .
2.3. Parameters Assessment and Vulnerability Levels
The DRASTIC index expressed in equation 1 possesses three important properties. First, the index value can be numerically calculated and confronted with the referential values given in Table 1 to pronounce judgment related to the vulnerability of groundwater at the study location. Secondly, one should notice that all the individual terms DRASTICterm of the equation are georeferenced data, i.e., each is computed for a certain geographical location, thus having at least a longitude X and a latitude Y. Therefore, even if each term does not possess exactly the same (X, Y) geographical coordinates than its neighbor, a layer map can be produced with (X, Y, DRASTICterm) using a GIS software. In ArcGIS 10 software, the Kriging interpolation algorithm in the Geostatistical Analyst extension was used to map layer map for every term . Afterwards, the linear combination of all the seven layers equation 1 is computed in GIS to produce the vulnerability map for the study area (Figure 3).
Table 1. Groundwater vulnerability assessment for DRASTIC, GOD and SI methods (range, rate weight).

Vulnerability index

Groundwater Vulnerability

DRASTIC

GOD

SI

Very low

< 80

NA

NA

Low

80-120

0.1-0.3

< 45

Moderate

121-160

0.3-0.5

45-64

High

161-200

0.5-0.7

65-85

Very high

> 200

0.7-1.0

> 85

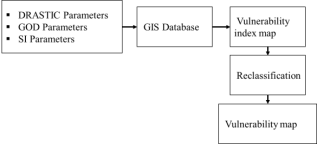
Figure 3. Flowchart for DRASTIC, GOD and SI methods.
The quality of the vulnerability maps depends, among other things, on the data and the processing to which they have been subjected . In the case of this study, the integration of the results of the field work conducted during the period of April 2020 to January 2021 has complemented the knowledge of the territory that the compilation of existing data had allowed.
2.4. DRASTIC Depth of Water Table D (m)
The “depth of water table” parameter D was evaluated by interpolating between the water-level data collected from the eleven large diameter wells in the valley bottom and the dam (Figure 4). It was assumed that a linear interpolation can be assumed between the depth of the water table in the wells and the 3 water levels in the subsurface drains within the valley (Figure 4). The 11 wells are all located in the south-east of the valley because the farmers of Boulbi do not dig permanent wells inside the valley. The existing wells were realized by a previous project. They are not used for irrigation during the rainy season during which the investigations were performed.
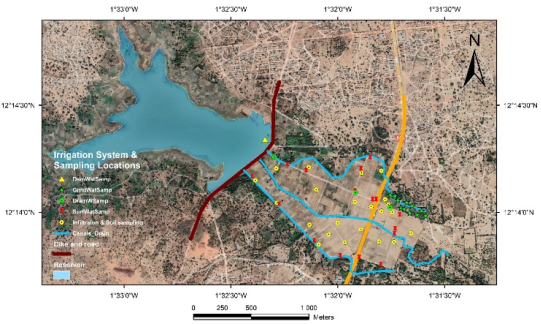
Figure 4. Boulbi irrigation system with infiltration and surface water and groundwater sampling locations.
2.5. The Recharge R (mm)
The recharge of aquifers by rainfall is subject to very large variations on a regional or national scale. At a given site, recharge also varies considerably from one year to the next, under the influence of interannual climatic fluctuations. The evaluation of natural groundwater recharge has always been very difficult, especially in basement rock supporting subsoil . Various techniques have been classically considered to achieve this, often requiring sophisticated and expensive equipment at the observation sites. Among these, the so-called climatic methods are the closest to direct measurements, evaluating recharge by simple difference between the terms of the water balance . All the methods used are based on different hypotheses and each is accompanied by uncertainty. Thornthwaite’s method is the only one that allows the expression of potential evapotranspiration (ETP) with easily accessible parameters : the average temperature of the air under shelter (atmospheric data) and the theoretical duration of insolation (astronomical data, a function of the season and latitude). It is given by the equation :
ETP=16.10.t.I.a.f(φ)(2)
With:
I=j=112(tj/5)1.51412
t: average air temperature of the period considered;
I: annual thermal index is the sum of twelve-monthly indices;
f (𝜑): corrective term depending on the theoretical duration of insolation, the latitude and the month;
a: complex function of the index I. a=0,016.I+0.5
The calculation of recharge with the Thornthwaite balance method is based on the diagram in Figure 5 according to which rainfall P on the watershed takes four destinations :
1) actual evapotranspiration (ETa);
2) runoff (Roff);
3) groundwater recharge or effective infiltration R;
4) the change in water storage in the soil (∆S), that is the variation of the readily available moisture storage of the soil ([∆S = RAMi-1-RAMi].
The average amount of rainfall is calculated by the equation below (3):
P=R+ETa+Roff±ΔS(3)
Where the variables are the ones previously described.
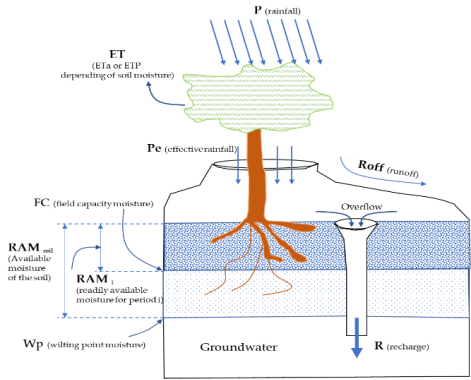
Figure 5. Description of variables used in Thornthwaite water balance equation to compute the net recharge R.
If one considers effective rainfall Pe by removing from the total rainfall P the runoff Roff, i.e., if Pe = P-Roff, then the net recharge R expression can be formulated (4) as it follows:
R=Pe-ETa+(RAMi-1-RAMi)(4)
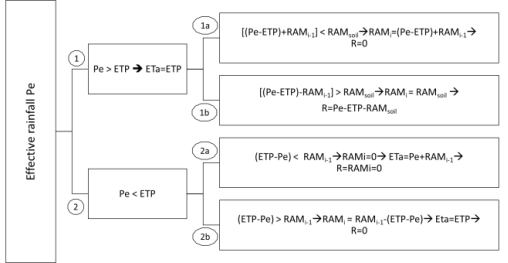
Figure 6. The 4 possible pathways from effective rainfall to net recharge R from the water balance equation.
The four possible pathways of the effective rainfall Pe that enters into the soil are described on Figure 6 whose variables are all described in Figure 5. The under-script “i” is related to the time step which is, in the current case, the month. Therefore the water balance is calculated from month to month and the process necessarily follows one of the 4 described pathways, according to whether the effective rainfall Pe is greater or smaller than the potential evapotranspiration given by Thornthwaite equation (2). The readily available moisture of the soil RAMsoil [which is in fact the Available Moisture AM, characteristic of a given soil] was determined by simulations with the 22 infiltration measurements by SWC [Soil Water Content Characteristics] software and Harmonized World Soil Database [HWSD] . It is visible from Figure 6 that the pathway “1-1 b” describes the unique condition that leads to a non-zero groundwater net recharge R, and its expression is given such as (5):
R=Pe-ETP-RAMsoil(5)
2.6. Soil Media S, Topography Slope T [%] and the Impact of the Vadose Zone I
As previously described, the soil media S was determined using 22 infiltration measurement data in the software SWC and Harmonized World Soil Database [HWSD] . The “soil type” used in DRASTIC is obtained by listing the different soil types according to the defined soil ranges [Table 1]. In the absence of a perfect match between a map unit and a soil range, a rating is assigned by analogy with an existing soil in the range . Once the soil media type is known, the corresponding impact of the vadose zone I can be determined from the ranges described in Table 1. For the “topography” slope T parameter, a raster map of the percentage of slope is made from the digital terrain method of the area and the slope values are assigned to the pixels according to the vulnerability method rating system.
2.7. Aquifer Saturated Hydraulic Conductivity C [m/day]
The groundwater found in the wells are located in the thick alterations covering the soil of Boubi valley bottom . Therefore, double ring infiltration measurements done on the soil surface can be reasonably considered as valid for the underlying soil . Infiltration measurements were performed in situ in May 2020, and yielded the infiltration rates. Infiltration measured by the double ring method is not very sensitive to the textural heterogeneity stratification of soils . The two rings are staffed concentrically, using a plank and a hammer, to a depth of about 5 cm in the ground. The principle is to follow the evolution of the water level as a function of time in the central ring . A total of 22 points were measured during the campaign. These points were selected to cover the entire valley bottom [Figure 4]. The data were processed with the statistical software, Minitab 18 , by applying a non-linear regression to the accumulated infiltration data to determine the saturated hydraulic conductivity [Ksat], i.e., the parameter C of the DRASTIC method.
2.8. Validation of Vulnerability Maps
In general, the development of a vulnerability map to agricultural pollution is validated by field measurements and chemical analysis of the water. Several authors tested the validity of the pollution vulnerability assessment methods based on groundwater chemistry data. For DRASTIC use in agricultural lands, the most important variable related to real-world groundwater pollution is nitrates . Most investigators look for a correlation between georeferenced nitrates measurements in the area and the vulnerability index map value (Table 1). It is important to note that a complete judgment can be drawn from the vulnerability index maps by qualifying this vulnerability as "very low", "low", "moderate", etc. However, this kind of judgment is not sufficient in itself, as it does not give an idea of the absolute value of a physicochemical pollutant in the real world. However, this kind of judgment is not sufficient in itself, as it does not give an idea of the absolute value of a physicochemical pollutant in the real world. The current study measured geo-referenced data on nitrates, phosphates, sulfates and potassium ions in surface and groundwater. These numerical data - often expressed in mg/l - should not be correlated with the vulnerability index values without knowing whether, intrinsically, they are "very low", "low" or "moderate", for example. Consequently, it is necessary to link numerical data to well-established external references. A common practice is to relate data on physicochemical pollutants to reference values provided by the World Health Organization, which indicate whether the results are "low", "high" or "dangerous" . Consequently, a comparison between the conclusions drawn from the pollution index and the measured data will enable valid conclusions to be drawn.
The GOD method (Figure 2) also uses an empirical approach where aquifer vulnerability is defined in terms of the inaccessibility of the saturated zone, in the sense of pollutant penetration, and the attenuation capacity of the layer above the saturated zone, i.e., it presents the vulnerability of the aquifer to vertical percolation of pollutants through the unsaturated zone and does not address the lateral migration of pollutants into the saturated zone . The three parameters used are: i) the identification of the type of aquifer in terms of its degree of confinement (Ci); ii) the depth of the water table (Cp) and iii) the characteristics of the layers overlying the saturated zone of the aquifer in terms of their relative porosity, permeability and water content (Ca). The vulnerability index (IGOD) is obtained by equation (6):
IGOD=Ci.Cp.Ca(6)
The processing, after matching the parameters with the referential values provided in Table 1, is very similar to the DRASTIC method.
2.9. Case of the SI Model
The SI (susceptibility index) method is a specific vertical vulnerability method developed by taking into account the behavior of pollutants of agricultural origin, mainly nitrates and pesticides . It uses five parameters: water table depth (D), net recharge (R), lithologic nature of the Aquifer (A), Topography of the land (T), and Land use (LU). The vulnerability index SI is obtained by calculating the vulnerability index (ISI) by the equation (7):
ISI=Dc.Dp+Rc.Rp+Ac.Ap+Tc.Tp+LUc.LUp(7)
The range and the rate of the parameters are given in Table 1 and the process of groundwater vulnerability mapping is very similar to DRASTIC method.
2.10. Inventory of Agricultural Inputs, Water Sampling and Physicochemical Analysis
The inventory of agricultural inputs was made in the form of a survey administered to 30 farmers spread over the entire valley bottom of Boulbi, during the month of August 2020. The purpose of these surveys—administered in individual form—was to list the different types of plant protection products and chemical fertilizers used on the plain, as well as the quantities applied per campaign.
All the questions put to rice growers in the Boulbi valley on the use of pesticides and fertilisers are recorded in supplementary material S2.
In order to carry out the inventory for pollution assessment in the study area, 32 water samples were taken at various points in the valley: in wells, in drains, in plots and at the dam (Figure 4). For each sampling point, three 0.5-liter samples of water were taken, using 0.5-liter plastic bottles that had been rinsed three times with the water to be sampled. The aim was to determine the values of physical parameters such as pH and electrical conductivity, but also to characterize the quality of the water through chemical analysis by determining the concentrations of nitrate, phosphate, sulfate and potassium ions.
Sensitive physical parameters such as hydrogen potential (pH) and electrical conductivity (EC), which can easily change during transportation, were measured in situ on the unfiltered samples using a 3310 WTW handset 2 pH meter and a 3310 WTW handset, a conductivity meter. Before the chemical parameters’ measurements, a vacuum pump and a GFC filter were used for the sample’s pretreatment. Sulfate (SO42-), nitrate (NO3-), phosphorus (PO42-) ion concentrations were determined by molecular absorption spectrometry (direct reading DR 3900) , and potassium (K+) is determined by flame spectrometry .
3. Results and Discussions
3.1. Infiltration, Permeability and Available Moisture
The measured permeabilities (Ksat), introduced in the Soil Water Characteristics (SWC) software for the determination of the characteristic soil moisture, allowed to obtain, in combination with HWSD , several soil textures for the same permeability but with almost equal available moisture (AM) for soil textures that were obtained. The different textures obtained on SWC were clay-silt texture covering 41% of the valley area (which can also correspond to the clay), clay-sand or loamy-clay-sand texture, with an AM of 12.22 ± 1.9. The soils are not very differentiated as one can see in Figure 7 and clay is dominant with very small saturated hydraulic conductivity (permeability Ksat), essentially around 0.05 m/day when the DRASTIC soils ranges (Table 1) are used. The silty texture covers 37% of the valley bottom area, and can correspond to the following textures: loamy-sandy-clay, loamy silty, loamy with an average AM of 3.06 ± 0.02. Finally, the soils of silty-sandy texture cover 22% of the valley bottom area, but also fits the following textures: sandy-loamy and silty loamy with an average AM of 13.2 ± 4.10.
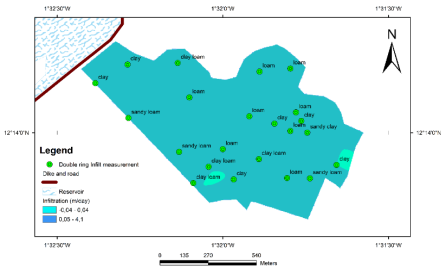
Figure 7. Double ring infiltration measurement and interpolated infiltration map of Boulbi valley.
3.2. Variability of the Water Table During the Year
The recharge of the aquifer calculated by the Thornthwaite balance is equal to 68.48 mm, i.e., 7% of the rainfall. It is higher than the values found in the altered aquifers in the Ouagadougou area, which range from 19.95 mm/year to 49.88 mm/year . This discrepancy can be explained by a higher value of the runoff coefficient inside the city of Ouagadougou. In fact, in irrigated rice field such as in Boulbi valley bottom, the use of delineation dikes of farm plots decreases runoff and subserve infiltration.
3.3. Agricultural Input Inventory
The survey provided an overview of the types of treatments applied by rice farmers in the study area. The most frequent treatments were herbicides, due to the quantity of weeds, and insecticide, due to crop pests. This situation fits with that described generally in Burkina Faso . The different types of inputs used in the Boulbi valley bottom are NPK (Nitrogen, Phosphorus and Potassium) (14-23-14) and urea. Organic manure use is very rare in the plain, mainly due to its high cost. Twenty (20) types of phytosanitary products are used on the irrigation scheme (Table 2), among which 35% are composed of the controversial glyphosate . Several studies indicate glyphosate to be a highly toxic and carcinogenic substance. It is also interesting to note that paraquat chloride—denounced to be responsible for several self-poisonings and forbidden in many countries —represents 30% of the herbicides used. The World Health Organization recommends restricting to trained persons, who respect the required precautions, the use of these products .
Table 2. List of phytosanitary products used in the Boulbi valley bottom.

TRADE NAME

PESTICIDE TYPE

ACTIVE SUBSTANCE

ADWURA WURA

Herbicide

GLYPHOSATE 360 g/l

ADOPA WURA

Herbicide

GLYPHOSATE 360 g/l

BIBANA

Herbicide

GLYPHOSATE 360 g/l

GROWNSATE

Herbicide

GLYPHOSATE 480 g/l

GANORSATE

Herbicide

GLYPHOSATE 480 g/l

SUNPHOSPHATE

Herbicide

GLYPHOSATE 350 g/l

ROUNDUP 360 SL

Herbicide

GLYPHOSATE 360 g/l

BENAXONE SUPER

Herbicide

PARAQUAT CHLORIDE 276 g/l

GRAMOQUAT SUPER

Herbicide

PARAQUAT CHLORIDE 276 g/l

GRAMOSHARP SUPER

Herbicide

PARAQUAT CHLORIDE 276 g/l

GRAMODA SUPER

Herbicide

PARAQUAT CHLORIDE 276 g/l

GRAMOKING 276 SL

Herbicide

PARAQUAT CHLORIDE 276 g/l

PARAKIN 276 SL

Herbicide

PARAQUAT CHLORIDE 276 g/l

EMACOT

Insecticide

EMAMECTINE BENZOATE

KAPAASE

Insecticide

EMAMECTINE BENZOATE 20 g/l; ABAMECTINE 20 g/l; ACETAMIPRIDE 40 g/l

DECIS 25 EC

Insecticide

DELTAMETHRINE 25 g/l

ALLIGATOR 400 EC

Herbicide

PENDIMETHALINE 400 g/l

PYRICAL

Insecticide

CHLOPYRIPHOS-ETHYL

SAMORY

Herbicide

BENSULFURON METHYL 100 g/kg

TOROL

Insecticide

LAMBDACYHALOTHRINE 16 g/l

3.4. Method Parameter Results
In general, the water table is shallow, with static levels varying from 2.22 m to 3.55 m (Table 3), thus assigning high elevation values to the parameter D in all the three methods. The net recharge (R) in the Boulbi valley bottom is low, averaging 68.48 mm/year. The Boulbi rice plain has a free water table. Analysis of the logs of boreholes drilled in the area shows that the lithologic nature of the Aquifer (A) is composed of alluvial deposits, essentially clay and granite. The types of soil (S) in place are essentially clay, clay loam and loamy sand. The calculated slopes (topography parameter T) give very low values, ranging from 0.0 to 4.0%. The vadose zone impact (I) range include mainly clay, metamorphic and igneous rocks. The permeability test using double rings has made it possible to determine the hydraulic conductivity (C) of the soils. The plain is essentially an agricultural area (land use parameter LU) with irrigated rice fields, irrigated vegetables and plantations (only the SI method is concerned by this parameter).
Table 3. Rating (r) values obtained for each parameter in the three vulnerability methods.

Rating (r) computed for the three vulnerability methods

Parameter

Range

DRASTIC

GOD

SI

Water table D (m)

2.22 - 3.55

9

1

90

Recharge R (mm/an)

68.48

3

30

Lithology A

Free water table /fractured granite

3

0.7

30

Type of soils

Laterite

3

Clay

1

Clay loam

4

Loamy sand

6

Topo slope T (%)

0 - 2%

10

100

2 - 4%

9

90

Vadose I

Clay,

3

0.55

Metamorphic and igneous rock

1

0.60

Hydraulic Conductivity C (m/s)

1.5‧10-7—5‧10–5

1

5‧10-5—15‧10–5

2

Land use LU

Rice, irrigated vegetables, plantations

-

-

90

3.5. Vulnerability Characterization
A range of low vulnerability occupying the entire surface of the plain, with indices oscillating between 83 and 88, shows on the map of the vulnerability to agricultural pollution by the DRASTIC method (Figure 8) that the plain benefits from a certain natural protection. The nature of the dominant soil with a very high clay content is a factor limiting the infiltration of pollutants into the aquifer, hence the relatively low vulnerability range. The figure yielded by the GOD method also shows moderate vulnerability range (Figure 9): it extends over the entire study area with indices between 0.35 and 0.42. These vulnerability indices suggest a less severe pollution of the plain in the event of contamination. This degree of medium vulnerability may be related to the nature of the vadose zone, essentially composed of clay and granite, and the dominant soil on the plain, composed of clay, which is not very permeable . Finally, the SI method, gives values that vary between 57.5 and 60 (Figure 10). The analysis of this map highlights a range of medium vulnerability, which occupies the entire plain. The results of SI maps were in agreement with the laboratory analysis of NO3- concentration in the groundwater for the entire 11 locations (Figure 12) for which all the values were found below 50 mg/l, the maximum defined by WHO [World Health Organization] . However, it should be noted that the results of the validation.
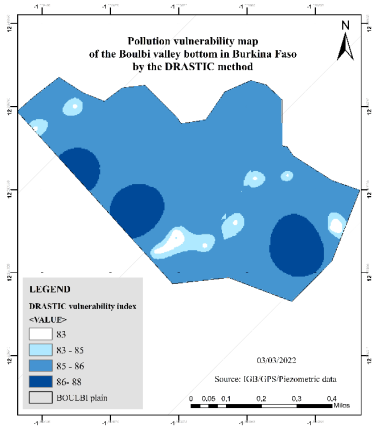
Figure 8. Pollution vulnerability map according to DRASTIC method.
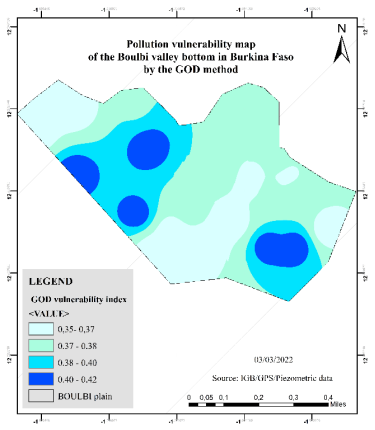
Figure 9. Pollution vulnerability map according to GOD method.
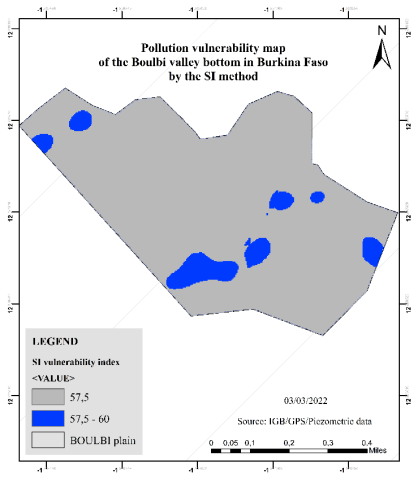
Figure 10. Pollution vulnerability map according to SI method.
3.6. Physicochemical Characteristics of the Collected Water
The parameters measured in the field concerned 32 samples, 21 of which were from surface water (plots of land, earthen drains, and in the dam) and 11 for water from large diameter wells present on the plain.
3.6.1. Hydrogen Potential
The surface water in the Boulbi valley bottom, at the level of the plots, the drains and the irrigation dam are clearly alkaline. The average pH value is 8.2 ± 0.4. The well groundwater of the valley bottom is slightly alkaline, even though close to neutrality with an average pH of 7.3 ± 0.24 (Figure 11). This alkalinity can be explained by at least two reasons. Firstly, the valley irrigation is fed by the water stored in the reservoir of the dam containing an important deposit of organic matter coming from upstream households of Boulbi. As a consequence, eutrophication is visible by the presence of aquatic plants like water hyacinth in the reservoir . Secondly, the presence of a thick layer of clay alterations in the rice-growing valley is an important factor of increase of water alkalinity . It should be noted that the pH of the irrigation water should be between 5.5 and 6.5 for better micronutrient absorption and improved photosynthesis and yield of the crops . This basic pH may partly explain the low yield of rice (less than 4.0 tons/ha) observed in Boulbi valley bottom in spite of the use of fertilizers. The pH values measured for Boulbi waters comply with the WHO recommendations for drinking water (6.5-8.5). Additionally, it can be noted that the pH values found are slightly higher than the values found by Ouandaogo in the waters of Ouagadougou. Finally, other authors found values of 6 to 8.5 in surface waters in sub-Saharan Africa (Dakouré, 2003; Souleymane et al., 2020) more in agreement with those of Boulbi.
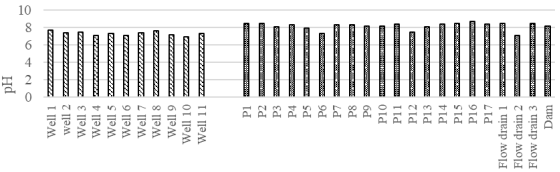
Figure 11. Result of the analysis of pH in well water and groundwater from the bottom of the Boulbi valley in Burkina Faso.
3.6.2. Electrical Conductivity (EC) and Nitrates
The average conductivity is higher for groundwater (195.6 ± 42.2) µs/cm than for surface water (156.9 ± 12.4) µs/cm (Figure 12). These conductivity values are too low to be able to cause any damage to rice. The waters (ground and surface water) are moderately mineralized as they are in the range of (150 to 300) µs/cm . It is known that the conductivity values of surface waters change according to the geological structure and the amount of precipitation . High EC values indicate the presence of a high concentration of dissolved salts in the water and also correspond to local or point source groundwater pollution during rainy periods.
Nitrate testing in water is a good indicator of raw water quality, and in the long-term nitrate contamination can generally lead to eutrophication of surface waters due to excessive nutrient and biodegradable matter inputs. Nitrate values vary significantly from surface water (4.29 ± 2.25) mg/l to well water (15.61 ± 10.36) mg/l. The results show higher nitrate concentrations in well water, mainly due to irrigation water flowing into protected wells with inadequate copings, fish farming, pastoral activities and runoff around and in the bottom of the Boulbi valley (Figure 12). These nitrate values are lower than WHO guidelines for surface waters (50 m g/l). Studies conducted by other investigators such as Tapsoba also report concentrations that are lower than the WHO standards for surface water in the Nakambe Basin in Burkina Faso, and in dams N°3 of Ouagadougou and Debe respectively of 34 m g/l; 6.6 m g/l and 9.2 m g/l.
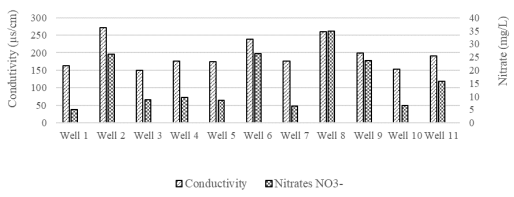
Figure 12. Results of the analysis of electrical conductivity and nitrate ion concentrations in water from wells at the bottom of the Boulbi Valley in Burkina Faso.
3.6.3. The O Phosphates (PO43-)
Analysis of the results shows very small phosphate concentrations ranging from (0.067 ± 0.02) mg/l to (0.065 ± 0.04) mg/l for groundwater and surface water respectively (Figure 13). These phosphorus values are significantly lower than the maximum EPA [US—Environmental Protection Agency] tolerated value of 0.1 mg/l and those found in several other countries like South Africa, Brazil, or New Zealand , but are close to those obtained by Tapsoba at the level of the dam N°3 of Ouagadougou (0.14 m g/l). A study conducted by Hammani showed that NO3- and PO43- ions found in surface waters are due to the use of organic fertilizer (organic manure). According to , concentrations of more than 0.5 mg/l and 0.02 mg/l of NO3- and PO43- respectively in surface waters, indicate pollution levels that may cause eutrophication. In situ observations and the low concentration of less than 0.07 mg/l in surface and groundwater of Boulbi show that eutrophication is not currently a major risk.
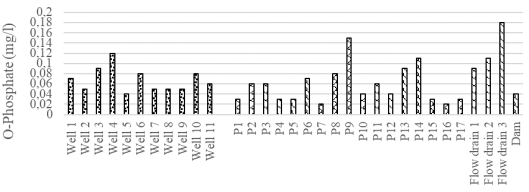
Figure 13. Result of the analysis of the phosphate ion in well water and groundwater from the Boulbi valley bottom in Burkina Faso.
3.6.4. Sulfate (SO42-) and Potassium K+
Sulfate levels in the water samples ranged from (0.0 to 3.0) m g/l, with an average of (1.18 ± 1.07) mg/l for groundwater and (0.57 ± 0.7) mg/l for surface water (Figure 14). These values are lower than the WHO standard limits of 250 mg/l. They are close to those obtained by Ayouba in the locality of Yamtenga in Burkina Faso, with values ranging from (0.0 to 9.0) mg/l. A study conducted in the sub-watershed of Tougou dam by Yaleu showed that sulfate values are higher during rainy periods than those without rain, which can be explained by the variation of the fertilizer dose as the plant grows.
The results of the potassium ion concentration in the samples give an average value of (5.05 ± 1.9) mg/l for surface water against (4.44 ± 1.4) mg/l for well water. These potassium concentration values are below the WHO standard limits (12 mg/l) . Potassium is generally less abundant in water and does not usually exceed 10 m g/l.
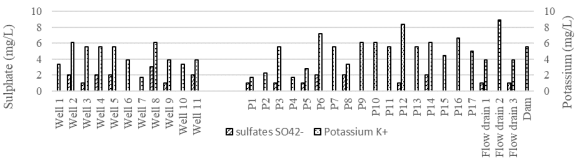
Figure 14. Results of the analysis of the ion sulfate and potassium ion concentration in wells’ water and ground.
4. Conclusion
The problems associated with water pollution are currently a source of concern that requires universal interest. The case study of the impact of irrigation, pesticides and chemical fertilizers on water quality was investigated in the soil of irrigated rice in Burkina Faso's Boulbi Valley. The soils are mainly clayey (41%), loamy (37%) and sandy loam (22%). Due to the construction of bunds around rice plots, the annual aquifer recharge of 68.48 mm accounts for 7% of rainfall. Two types of fertilizers are used in the valley—NPK (14-23-14) and urea 46% —while twenty types of phytosanitary products are used, among which 35% consist of controversial glyphosate (accused of being carcinogenic) and 30% are based on paraquat chloride, also accused of being responsible for various self-poisonings and which is banned in many countries. DRASTIC provided indices that fluctuate between 83 and 88, indicating a low vulnerability. The SI method maps values of NO3- in agreement with laboratory analysis of NO3- concentration in the waters of 17 sites of flooded farm plots, 3 subsurface drainage sites and 11 sites of wells groundwater. For these 41 sites, the values were found to be below 50 mg/l, the maximum defined by the WHO. The results of the physicochemical analyze showed that the surface water of the plots, the drains and the irrigation dam are clearly alkaline. The average pH value amounted to 8.2 ± 0.4. This alkaline pH, linked to the presence of clay soils, may partly explain the low rice yield (less than 4.0 tons/ha) observed at Boulbi, despite the use of fertilizers. Nitrate concentrations vary considerably from surface water (4.29 ± 2.25) mg/l to spring water (15.61 ± 10.36) mg/l. The higher nitrate concentrations in the well are mainly due to irrigation water flowing into unprotected wells. However, these nitrate values are lower than the WHO guidelines for surface water (50 mg/l). In situ observations and the low concentration of less than 0.07 mg/l (the US-EPA limit is 0.1 mg/l) in Boulbi's surface and groundwater show that eutrophication does not currently represent a significant threat. The sulphate content in the 32 surface water samples ranged from (0.0 to 3.0) mg/l, with an average of (1.18 ± 1.07) mg/l for groundwater and (0.57 ± 0.7) mg/l for surface water, values below WHO standard limits (250 mg/l). The potassium ion concentrations in the samples give an average value of (5.05 ± 1.9) mg/l for surface water against (4.44 ± 1.4) mg/l for well water, which values are also below the standard limits of WHO (12 mg/l). Although the risk assessment rendered non-alarming situation, it is necessary to take preventive measures in order to preserve farmers and water resources by raising awareness among the population concerning health and environmental threats.
Abbreviations

A

Aquifer Media

AM

Available Moisture

C

Aquifer Hydraulic Conductivity

D

Depth of the Water Table

D

the Depth of the Water Table Surface in GOD Model

EPA

US—Environmental Protection Agency

ETa

Actual Evapotranspiration

ETP

Potential Evapotranspiration

G

Type of Groundwater

GIS

Geographic Information System

HWSD

Harmonized World Soil Database

I

Impact of Vadose Zone

LU

Land Use

NPK

Nitrogen, Phosphorus and Potassium

O

Lithological characteristics (letter O) of the Layer Overlying the Aquifer

P

Pesticides

Pe

Effective Rainfall

R

Net Recharge

RAM

Readily Available Moisture

Roff

Runoff

S

Soil Media

SI

Susceptibility Index

SWC

Soil Water Characteristics

T

Topography, the Average Terrain Slope

w

Weight

WHO

World Health Organization

X

Longitude

Y

Latitude

Acknowledgments
Authors would like to thank Mr. Seth Nii Moi Allotey, a lecturer at the Language Centre, University of Ghana, Legon, for taking time to read and correct this paper.
Author Contributions
Amadou Keïta: Conceptualization, Data curation, Formal Analysis, Investigation, Methodology, Resources, Writing – original draft, Writing – review & editing
Moussa Bruno Kafando: Conceptualization, Data curation, Methodology, Resources, Writing – original draft, Writing – review & editing
Seyram Kossi Sossou: Data curation, Methodology
Maanou Rosella Axiane Mantoro: Conceptualization, Data curation, Formal Analysis, Investigation, Methodology, Resources
Delphine Aissata Bama: Conceptualization, Data curation, Formal Analysis, Investigation, Methodology, Resources
Funding
This work was financially supported by the World Bank through its Excellency Centre in Africa (CEA) of which the International Institute for Water and Environmental Engineering (2iE) is a partner.
Data Availability Statement
The data is available from the corresponding author upon reasonable request.
Conflicts of Interest
The authors declare no conflicts of interest.
Supplementary Material

Below is the link to the supplementary material:

Supplementary Material 1.docx

References
[1] Liu R, Peipei Z, Wang X, Chen Y, Shen Z. Assessment of effects of best management practices on agricultural non-point source pollution in Xiangxi River watershed. Agric Water Manag 2013; 117: 9–18.
[2] Liu Y, XB P, JS L. A 1961-2010 record of fertilizer use, pesticide application and cereal yields: a review. Agron Sustain Dev 2014.
[3] Dědina M, Jevič P, Čermák P, Moudrý J, Mukosha CE, Lošák T, et al. Environmental Life Cycle Assessment of Silage Maize in Relation to Regenerative Agriculture. Sustainability 2024; 16.
[4] He R, Shao C, Shi R, Zhang Z, Zhao R. Development Trend and Driving Factors of Agricultural Chemical Fertilizer Efficiency in China. Sustainability 2020; 12.
[5] Rzyska K, Stuper-Szablewska K, Kurasiak-Popowska D. Diverse Approaches to Insect Control: Utilizing Brassica carinata (A.) Braun and Camelina sativa (L.) Crantz Oil as Modern Bioinsecticides. Forests 2024; 15.
[6] Silva M da GC, Medeiros AO, Converti A, Almeida FCG, Sarubbo LA. Biosurfactants: Promising Biomolecules for Agricultural Applications. Sustainability 2024; 16.
[7] Temgoua RCT, Bussy U, Alvarez-Dorta D, Galland N, Njanja E, Hémez J, et al. Electrochemistry-coupled to liquid chromatography-mass spectrometry-density functional theory as a new tool to mimic the environmental degradation of selected phenylurea herbicides. Environ Sci Process Impacts 2021; 23: 1600–11.
[8] Krupka M, Olkowska E, Klimkowicz-Pawlas A, Łęczyński L, Tankiewicz M, Michalczyk DJ, et al. The Impact of Soil and Water Pollutants Released from Poultry Farming on the Growth and Development of Two Plant Species. Agriculture 2024; 14: 87.
[9] Mudaly L, van der Laan M. Interactions between Irrigated Agriculture and Surface Water Quality with a Focus on Phosphate and Nitrate in the Middle Olifants Catchment, South Africa. Sustainability 2020; 12: 4370.
[10] Pacheco FAL, Pires LMGR, Santos RMB, Sanches Fernandes LF. Factor weighting in DRASTIC modeling. Sci Total Environ 2015; 505: 474–86.
[11] Rana R, Ganguly R, Gupta AK. Indexing method for assessment of pollution potential of leachate from non-engineered landfill sites and its effect on ground water quality. Environ Monit Assess 2017; 190: 46.
[12] Neukum C, Hötzl H, Himmelsbach T. Validation of vulnerability mapping methods by field investigations and numerical modelling. Hydrogeol J 2007; 16: 641–58.
[13] Aller L, Bennet J, Lehr R, Petty, Hackett. DRASTIC: A standardised system for évaluating groundwater pollution potential using hydrogeologic settings. US Environ Agency EPA 1987: 641.
[14] Barbulescu A. Assessing Groundwater Vulnerability: DRASTIC and DRASTIC-Like Methods: A Review. Water 2020; 12: 1356.
[15] Narisetty NG, Tripathi G, Kanga S, Singh SK, Meraj G, Kumar P, et al. Integrated Multi-Model Approach for Assessing Groundwater Vulnerability in Rajasthan’s Semi-Arid Zone: Incorporating DRASTIC and SINTACS Variants. Hydrology 2023; 10: 231.
[16] Larva O, Brkić Ž, Marković T. Vulnerability and Risk of Contamination of the Varaždin Aquifer System, NW Croatia. Sustainability 2023; 15: 16502.
[17] Zhang Q, Shan Q, Chen F, Liu J, Yuan Y. Groundwater Vulnerability Assessment and Protection Strategy in the Coastal Area of China: A GIS-Based DRASTIC Model Approach. Appl Sci 2023; 13: 10781.
[18] Sekar S, Kamaraj J, Poovalingam S, Duraisamy R, Senapathi V, Sang Yong C. Appraisal of Groundwater Vulnerability Pollution Mapping Using GIS Based GOD Index in Tiruchendur, Thoothukudi District, India. Water 2023; 15: 520.
[19] Duarte L, Espinha Marques J, Teodoro AC. An Open Source GIS-Based Application for the Assessment of Groundwater Vulnerability to Pollution. Environments 2019; 6: 86.
[20] Fannakh A, Farsang A. DRASTIC, GOD, and SI approaches for assessing groundwater vulnerability to pollution: a review. Environ Sci Eur 2022; 34: 77.
[21] Meerkhan H, Teixeira J, Espinha Marques J, Afonso MJ, Chaminé HI. Delineating Groundwater Vulnerability and Protection Zone Mapping in Fractured Rock Masses: Focus on the DISCO Index. Water 2016; 8: 462.
[22] Ribeiro L, Pindo JC, Dominguez-Granda L. Assessment of groundwater vulnerability in the Daule aquifer, Ecuador, using the susceptibility index method. Sci Total Environ 2017; 574: 1674–83.
[23] Jamali MY, Namous M, Tallou A, Khadija A, Amir S. Estimation of Groundwater Vulnerability to Pollution Based on DRASTIC and SI Methods: A Case Study of the Irrigated Area of Tadla Plain, Oum Errabia Basin, Morocco. Proc 4th Ed Int Conf Geo-IT Water Resour 2020 Geo-IT Water Resour 2020 2020: 1–5.
[24] République de Chine-Burkina Faso: Etat des lieux de la coopération - leFaso.net [Republic of China-Burkina Faso: State of play of cooperation] n.d.
[25] Le Burkina Faso annonce la rupture de ses relations diplomatiques avec Taïwan – Jeune Afrique. JeuneAfrique.com n.d.
[26] Ouattara K, Pare S, Sawadogo-Kabore S, Cinderby S, Bruin A de. Watershed level baseline assessment in the Nariarlé watershed, Volta basin, Burkina Faso. Gates Open Res 2019; 3: 306.
[27] Direction de l’Inventaire des Ressources Hydrauliques (DIRH). Carte hydrogéologique du BURKINA FASO [Hydrogeological map of Burkina Faso]. FAO Map Cat 1993.
[28] Sayoba K, Samuel N, Julien N. Modeling of the Alteration Wedge in a Crystalline Basement Environment: Case Study of Burkina Faso Central Regions. Sustain Environ 2018; 3: 83.
[29] Akurugu BA, Chegbeleh LP, Yidana SM. Characterisation of groundwater flow and recharge in crystalline basement rocks in the Talensi District, Northern Ghana. J Afr Earth Sci 2020; 161: 103665.
[30] Chesworth W. Encyclopedia of soil science. Dordrecht, The Netherlands: Springer; 2008.
[31] Keïta A, Niang D, Sandwidi SA. How Non-Governmental-Organization-Built Small-Scale Irrigation Systems Are a Failure in Africa. Sustainability 2022; 14: 11315.
[32] Machiwal D, Jha MK, Singh VP, Mohan C. Assessment and mapping of groundwater vulnerability to pollution: Current status and challenges. Earth-Sci Rev 2018; 185: 901–27.
[33] Guettaia S, Hacini M, Boudjema A, Zahrouna A. Vulnerability assessment of an aquifer in an arid environment and comparison of the applied methods: case of the mio-plio-quaternary aquifer. Energy Procedia 2017; 119: 482–9.
[34] Neritarani R, Sejati SP. The Impact of Rapid Urban Growth on Potential Groundwater Pollution in Ngemplak Sub-District, Sleman District. J Wil Dan Lingkung 2021; 9: 198–212.
[35] Sartika D, Muhni A, Rifqan R, Putra HS. Groundwater Vulnerability to Pollution Using the GOD Method in Banda Aceh City, Aceh Province. J Aceh Phys Soc 2020; 9: 84–90.
[36] Shrestha S, Kafle R, Pandey VP. Evaluation of index-overlay methods for groundwater vulnerability and risk assessment in Kathmandu Valley, Nepal. Sci Total Environ 2017; 575: 779–90.
[37] Ghazavi R, Ebrahimi Z. Assessing groundwater vulnerability to contamination in an arid environment using DRASTIC and GOD models. Int J Environ Sci Technol 2015; 12: 2909–18.
[38] Alwarhaf Y, El Mansouri B. Assessment of Aquifer Vulnerability Based on GIS and ARCGIS Methods: A Case Study of the Sana’a Basin (Yemen). J Water Resour Prot 2011; 3: 845–55.
[39] Rusagara R, Koïta M, Plagnes V, Jost A. Groundwater recharge pathways to a weathered-rock aquifer system in a dryland catchment in Burkina Faso. Hydrogeol J 2022; 30: 1489–512.
[40] FILIPPI C, MILVILLE F, THIERY D. Evaluation of natural recharge to aquifers in the Sudan-Sahel climate using global hydrological modelling: application to ten sites in Burkina Faso. Hydrol Sci J 1990; 35: 29–48.
[41] Gudulas K, Soulios G, Dimopoulos G. Comparison of different methods to estimate actual evapotranspiration and hydrologic balance. Desalination Water Treat 2013; 51: 2945–54.
[42] Souleymane IMS, Babaye MSA, Alhassane I, Issoufou S, Boureima O. Caractérisations Hydroclimatiques et Estimation du Taux de Recharge de la Nappe Libre du Haut Bassin Versant de la Korama, Commune de Droum/Région de Zinder/Niger [Hydroclimatic Characterisation and Assessment of Water Table Recharge Rate of the High River Basin of Korama Township, Droum/Zinder Region/Niger]. Eur Sci J ESJ 2020; 16: 318–318.
[43] Dakouré D. Etude hydrogéologique et geochimique de la bordure sud-est du bassin sedimentaire de Taoudeni au Burkina Faso-Mali: essaide modélisation. Université Paris IV - Pierre et Marie curie; 2003.
[44] Saxton KE, Rawls WJ, Romberger JS, Papendick RI. Estimating Generalized Soil-water Characteristics from Texture. Soil Sci Soc Am J 1986; 50: 1031–6.
[45] Nachtergaele F, van Velthuizen H, Verest L, Wiberg D. Harmonized World Soil Databaze - Version 1.2. FAO, IIASA, ISRIC, ISSCAS, JRC; 2012.
[46] Minai J, Libohova Z, Schulze DG. Disaggregation of the 1:100,000 Reconnaissance soil map of the Busia Area, Kenya using a soil landscape rule-based approach. CATENA 2020; 195: 104806.
[47] Keïta A, Zorom M, Faye MD, Damba DD, Konaté Y, Hayde LG, et al. Achieving Real-World Saturated Hydraulic Conductivity: Practical and Theoretical Findings from Using an Exponential One-Phase Decay Model. Hydrology 2023; 10: 235.
[48] Zhang J, Lei T, Qu L, Chen P, Gao X, Chen C, et al. Method to measure soil matrix infiltration in forest soil. J Hydrol 2017; 552: 241–8.
[49] Arriaga FJ, Kornecki TS, Balkcom KS, Raper RL. A method for automating data collection from a double-ring infiltrometer under falling head conditions. Soil Use Manag 2010; 26: 61–7.
[50] Mathews PG. Design of experiments with Minitab. Wisconsin. USA: ASQ Quality Press; 2005.
[51] Ghouili N, Jarraya-Horriche F, Hamzaoui-Azaza F, Zaghrarni MF, Ribeiro L, Zammouri M. Groundwater vulnerability mapping using the Susceptibility Index (SI) method: Case study of Takelsa aquifer, Northeastern Tunisia. J Afr Earth Sci 2021; 173: 104035.
[52] Khakhar M, Ruparelia JP, Vyas A. Assessing groundwater vulnerability using GIS-based DRASTIC model for Ahmedabad district, India. Environ Earth Sci 2017; 76: 440.
[53] Qasim M, Ali Jakhrani M. Physicochemical and elemental contamination assessment in groundwater samples of Khairpur Mir’s, Pakistan. Hum Ecol Risk Assess Int J 2018; 24: 870–85.
[54] Sener E, Sener S, Davraz A. Assessment of aquifer vulnerability based on GIS and DRASTIC methods: a case study of the Senirkent-Uluborlu Basin (Isparta, Turkey). Hydrogeol J 2009; 17: 2023.
[55] Hach. Hach DR 3900 (Spectrophotometer) User manual. 9/2020 Edition 10. Https://Www.Hach.Com/Asset-Get.Download.Jsa?Id=7639984267 Hach Company/Hach Lange GmbH; 2020.
[56] Saxton KE, Rawls WJ. Soil water characteristic estimates by texture and organic matter for hydrologic solutions. Sci Soc Am J 2006; 70: 1569–78.
[57] Bodenstein D, Clarke C, Watson A, Miller J, van der Westhuizen S, Rozanov A. Evaluation of global and continental scale soil maps for southern Africa using selected soil properties. CATENA 2022; 216: 106381.
[58] Hie M. Etude géochimique et piézométrique des eaux souterraines de la region de Ouagadougou au Burkina Faso [Geochemical and piezometric study of groundwater in Ouagadougou region in Burkina Faso].
[59] Sawadogo VR. Pratiques paysannes d’utilisation des pesticides en cultures maraîchères et leurs effets induits dans la Vallée du Sourou : Cas du périmètre de Di [Farmers practices of pesticide use in vegetable crops and their induced effects in the Sourou Valley: Case of the Di perimeter].
[60] Kim J-W, Kim D-S. Paraquat: Toxicology and Impacts of Its Ban on Human Health and Agriculture. Weed Sci 2019; 68: 208–13.
[61] WHO. Environmental Health Criteria 39: PARAQUAT AND DIQUAT. Https://Apps.Who.Int/Iris/Bitstream/Handle/10665/37301/9241540994-Eng.Pdf: World Health Organization;1984
[62] Ouandaogo/Yameogo S. Ressources en eau souterraine du centre urbain de Ouagadougou au Burkina Faso, qualité et vulnérabilité [Groundwater resources in urban centre of Ouagadougou in Burkina Faso, quality and vulnerability]. Avignon, 2008.
[63] Ward MH, Jones RR, Brender JD, de Kok TM, Weyer PJ, Nolan BT, et al. Drinking Water Nitrate and Human Health: An Updated Review. Int J Environ Res Public Health 2018; 15: 1557.
[64] Hamza MH, Added A, Francés A, Rodríguez R. Validité de l’application des méthodes de vulnérabilité DRASTIC, SINTACS et SI à l’étude de la pollution par les nitrates dans la nappe phréatique de Metline–Ras Jebel–Raf Raf (Nord-Est tunisien). Comptes Rendus Geosci 2007; 339: 493–505.
[65] Stigter TY, Ribeiro L, Dill AMMC. Evaluation of an intrinsic and a specific vulnerability assessment method in comparison with groundwater salinisation and nitrate contamination levels in two agricultural regions in the south of Portugal. Hydrogeol J 2006; 14: 79–99.
[66] Liu Y, Li L, Zheng L, Fu P, Wang Y, Nguyen H, et al. Antioxidant responses of triangle sail mussel Hyriopsis cumingii exposed to harmful algae Microcystis aeruginosa and high pH. Chemosphere 2020; 243: 125241.
[67] McLachlan JW, Gunadasa SG, Guppy CN. Emergence and Early Growth of Four Desmanthus Species in Three Alkaline Clay Soils. Agronomy 2023; 13: 2996.
[68] Chapman DV, Organization WH, UNESCO, Programme UNE. Water quality assessments: a guide to the use of biota, sediments and water in environmental monitoring. Https://Apps.Who.Int/Iris/Handle/10665/41850 E & FN Spon; 1996
[69] Abai EA, Ombolo A, Ngassoum MB, Mbawala A. Suivi de la qualité physico-chimique et bactériologique des eaux des cours d’eau de Ngaoundéré, au Cameroun [Monitoring the physico-chemical and bacteriological quality of the waters of the rivers of Ngaoundéré, Cameroon ]. Afr Sci Rev Int Sci Technol 2014; 10: 135–45.
[70] Ferreira JFS, Liu X, Suarez DL. Fruit yield and survival of five commercial strawberry cultivars under field cultivation and salinity stress. Sci Hortic 2019; 243: 401–10.
[71] Tepe Y, Boyd CE. A Reassessment of Nitrogen Fertilization for Sunfish Ponds. World Aquac Soc 2007; 34: 505–11.
[72] Tapsoba FW, Kere FD, Diarra J, Barry A, Sawadogo-Lingani H, Dianou D, et al. Etude de l’évolution des éléments précurseurs d’eutrophisation des eaux du Barrage n°3 de Ouagadougou, Burkina Faso [Study of the evolution of the precursor elements of eutrophication of the waters of the Dam No. 3 of Ouagadougou, Burkina Faso. Int J Biol Chem Sci 2016; 10: 846–59.
[73] Warrack J, Kang M, Sperber C von. Groundwater phosphorus concentrations: global trends and links with agricultural and oil and gas activities. Environ Res Lett 2021; 17: 014014.
[74] Hammami J, Brahim M, Gueddari M. Essai d’évaluation de la qualite des eaux de ruissellement du bassin versant de la lagune de Bizerte. Inst Natl Sci Technol Mer 2005; 32: 69–77.
[75] Zacharias I, Bertachas I, Skoulikidis N, Koussouris T. Greek Lakes: Limnological overview. Lakes Reserv Sci Policy Manag Sustain Use 2002; 7: 55–62.
[76] Mahamane AA, Guel B. Caractérisations physico-chimiques des eaux souterraines de la localité de Yamtenga (Burkina Faso). Int J Biol Chem Sci 2015; 9: 517–33.
[77] Yaleu SB-M, Hahiou AD, Guel B. Assessment of Surface Water Contamination by Heavy Metals Due to Agricultural Practices in the Northern Part of Burkina Faso. Int Res J Pure Appl Chem 2020: 85–98.
[78] Meride Y, Ayenew B. Drinking water quality assessment and its effects on residents health in Wondo genet campus, Ethiopia. Environ Syst Res 2016; 5: 1.
Cite This Article
  • APA Style

    Keïta, A., Kafando, M. B., Sossou, S. K., Mantoro, M. R. A., Bama, D. A. (2024). Assessment of the Vulnerability of Aquifers in Basement Areas to Pollution from Agriculture: The Case of the Boulbi Rice Plain in Burkina Faso. American Journal of Environmental Protection, 13(3), 49-68. https://doi.org/10.11648/j.ajep.20241303.11

    Copy | Download

    ACS Style

    Keïta, A.; Kafando, M. B.; Sossou, S. K.; Mantoro, M. R. A.; Bama, D. A. Assessment of the Vulnerability of Aquifers in Basement Areas to Pollution from Agriculture: The Case of the Boulbi Rice Plain in Burkina Faso. Am. J. Environ. Prot. 2024, 13(3), 49-68. doi: 10.11648/j.ajep.20241303.11

    Copy | Download

    AMA Style

    Keïta A, Kafando MB, Sossou SK, Mantoro MRA, Bama DA. Assessment of the Vulnerability of Aquifers in Basement Areas to Pollution from Agriculture: The Case of the Boulbi Rice Plain in Burkina Faso. Am J Environ Prot. 2024;13(3):49-68. doi: 10.11648/j.ajep.20241303.11

    Copy | Download

  • @article{10.11648/j.ajep.20241303.11,
      author = {Amadou Keïta and Moussa Bruno Kafando and Seyram Kossi Sossou and Maanou Rosella Axiane Mantoro and Delphine Aissata Bama},
      title = {Assessment of the Vulnerability of Aquifers in Basement Areas to Pollution from Agriculture: The Case of the Boulbi Rice Plain in Burkina Faso
    },
      journal = {American Journal of Environmental Protection},
      volume = {13},
      number = {3},
      pages = {49-68},
      doi = {10.11648/j.ajep.20241303.11},
      url = {https://doi.org/10.11648/j.ajep.20241303.11},
      eprint = {https://article.sciencepublishinggroup.com/pdf/10.11648.j.ajep.20241303.11},
      abstract = {Groundwater is a major source of water, meeting the domestic water needs of more than 70% of Africa's population. Although prized for its relatively good quality compared with surface water, groundwater is increasingly subjected to multiple sources of pollution. Long thought to be the solution to increasing agricultural production and achieving food self-sufficiency, agricultural inputs are now being pointed out in Burkina Faso as a major source of water pollution. However, few studies exist showing the contribution of agricultural inputs to groundwater pollution. The aim of this study is to show the impact of the use of agricultural inputs on groundwater quality: the case of the Boulbi valley rice-growing area in Burkina Faso, West Africa. Soil properties were measured using a double-ring infiltrometer and Harmonized World Soil Database. Groundwater recharge was assessed by Thornthwaite’s equation. The DRASTIC, GOD and SI methods were applied to map the valley’s vulnerability. Fertilizers and phytochemicals were recorded by surveys. A sampling of surface and groundwater was done in 32 locations and the chemical characteristics (pH, EC, NO3-, SO42-, PO42- and K+) confronted with the vulnerability indices. Results show that the soils were predominantly clay (41%), silt (37%) and silty sand (22%). Twenty types of phytochemicals were used, among which 35% were composed of the controversial glyphosate (denounced as carcinogenic) and 30% made with paraquat chloride also accused of being responsible for several self-poisoning. All the three methods pointed to a low vulnerability risk, partly because of the purification role of clay. The average pH is 8.2 ± 0.4, explaining the low-rice yield (<4.0 tons/ha), in spite of fertilizer use. Although the risk assessment rendered non-alarming situation, preventive measures about health and environment need to be taken.
    },
     year = {2024}
    }
    

    Copy | Download

  • TY  - JOUR
    T1  - Assessment of the Vulnerability of Aquifers in Basement Areas to Pollution from Agriculture: The Case of the Boulbi Rice Plain in Burkina Faso
    
    AU  - Amadou Keïta
    AU  - Moussa Bruno Kafando
    AU  - Seyram Kossi Sossou
    AU  - Maanou Rosella Axiane Mantoro
    AU  - Delphine Aissata Bama
    Y1  - 2024/06/27
    PY  - 2024
    N1  - https://doi.org/10.11648/j.ajep.20241303.11
    DO  - 10.11648/j.ajep.20241303.11
    T2  - American Journal of Environmental Protection
    JF  - American Journal of Environmental Protection
    JO  - American Journal of Environmental Protection
    SP  - 49
    EP  - 68
    PB  - Science Publishing Group
    SN  - 2328-5699
    UR  - https://doi.org/10.11648/j.ajep.20241303.11
    AB  - Groundwater is a major source of water, meeting the domestic water needs of more than 70% of Africa's population. Although prized for its relatively good quality compared with surface water, groundwater is increasingly subjected to multiple sources of pollution. Long thought to be the solution to increasing agricultural production and achieving food self-sufficiency, agricultural inputs are now being pointed out in Burkina Faso as a major source of water pollution. However, few studies exist showing the contribution of agricultural inputs to groundwater pollution. The aim of this study is to show the impact of the use of agricultural inputs on groundwater quality: the case of the Boulbi valley rice-growing area in Burkina Faso, West Africa. Soil properties were measured using a double-ring infiltrometer and Harmonized World Soil Database. Groundwater recharge was assessed by Thornthwaite’s equation. The DRASTIC, GOD and SI methods were applied to map the valley’s vulnerability. Fertilizers and phytochemicals were recorded by surveys. A sampling of surface and groundwater was done in 32 locations and the chemical characteristics (pH, EC, NO3-, SO42-, PO42- and K+) confronted with the vulnerability indices. Results show that the soils were predominantly clay (41%), silt (37%) and silty sand (22%). Twenty types of phytochemicals were used, among which 35% were composed of the controversial glyphosate (denounced as carcinogenic) and 30% made with paraquat chloride also accused of being responsible for several self-poisoning. All the three methods pointed to a low vulnerability risk, partly because of the purification role of clay. The average pH is 8.2 ± 0.4, explaining the low-rice yield (<4.0 tons/ha), in spite of fertilizer use. Although the risk assessment rendered non-alarming situation, preventive measures about health and environment need to be taken.
    
    VL  - 13
    IS  - 3
    ER  - 

    Copy | Download

Author Information
  • Laboratory of Water, Hydro-Systems and Agriculture (LEHSA), International Institute for Water and Environmental Engineering (2iE), Ouagadougou, Burkina Faso

  • Laboratory of Water, Hydro-Systems and Agriculture (LEHSA), International Institute for Water and Environmental Engineering (2iE), Ouagadougou, Burkina Faso

  • Laboratory of Water, Hydro-Systems and Agriculture (LEHSA), International Institute for Water and Environmental Engineering (2iE), Ouagadougou, Burkina Faso

  • Laboratory of Water, Hydro-Systems and Agriculture (LEHSA), International Institute for Water and Environmental Engineering (2iE), Ouagadougou, Burkina Faso

  • Department of Vegetable Production, Institute of Environment and Agricultural Research (INERA), Ouagadougou, Burkina Faso

  • Abstract
  • Keywords
  • Document Sections

    1. 1. Introduction
    2. 2. Material & Methods
    3. 3. Results and Discussions
    4. 4. Conclusion
    Show Full Outline
  • Abbreviations
  • Acknowledgments
  • Author Contributions
  • Funding
  • Data Availability Statement
  • Conflicts of Interest
  • Supplementary Material
  • References
  • Cite This Article
  • Author Information